Kitchen Builder
Team: Philippe Meister, Shamika Pujari, Hunter Sabers
Summary
Graphical fidelity is an understudied aspect of room-building applications offered by Ikea, Lowes, and Home Depot. We use Kitchen Builder to test whether users prefer to build a kitchen with low-fidelity (drafted) graphics or high-fidelity (photorealistic) graphics. We did not find evidence of significant effects on mental activity, satisfaction, or confidence. The results suggest that these companies can provide a good user experince with drafted or photorealistic graphics.
Introduction
Companies such as IKEA, Lowes, Menards, and Home Depot offer web-based services that allow users to build a room using the company’s product offerings. The services typically allow the user to choosing between a few options of room shape and insert the company’s product offerings into the room. The service is useful for the user if they want to source their products from the particular company. While all the services provide a standard "draft" graphics, only some provide realistically rendered 3D graphics.
This report focuses on the graphical fidelity of the visual representation of the kitchen. Fidelity degree of exactness with which something is copied or reproduced. Two reports frame the dynamics of graphical fidelity in this application. First, Gerling et al. (2013) studied graphical fidelity in games. They found that high fidelity graphics led to higher positive ratings of the game but were not needed for the game to be rated compelling or enjoyable. Second, Nehring (2009) studied graphical fidelity in nursing simulations for nursing education. Nehring found that graphical fidelity was a significant variable in participant’s nursing simulation experiences. Her study indicates that graphical fidelity may be important when the on-screen application has higher consequences in off-the-screen activities.
System Description
Kitchen builder is a room-building application that presents users with two options of graphical fidelity. Option one is a drafted (low fidelity) representation of the kitchen. Option two is a photorealistic (high fidelity) representation of the kitchen. Each level of fidelity may present a benefit to users. The low-fidelity version allows users to build their kitchen by specifying every individual aspect of the design. The high-fidelity version may add value to user inputs by including default colors and materials that the user can change later.
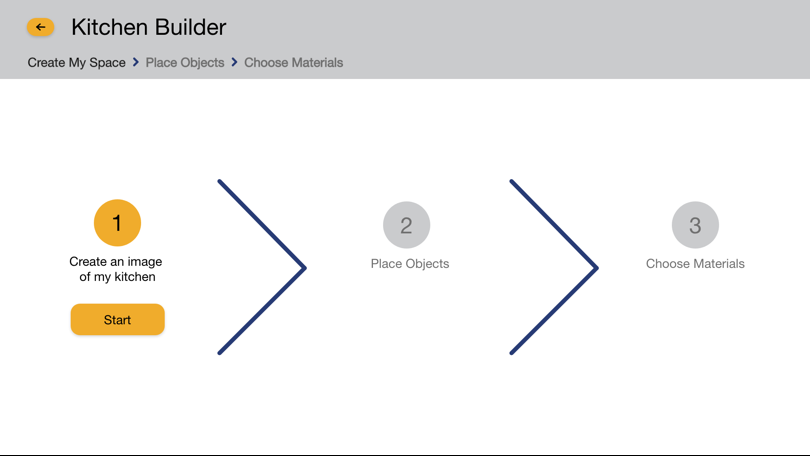
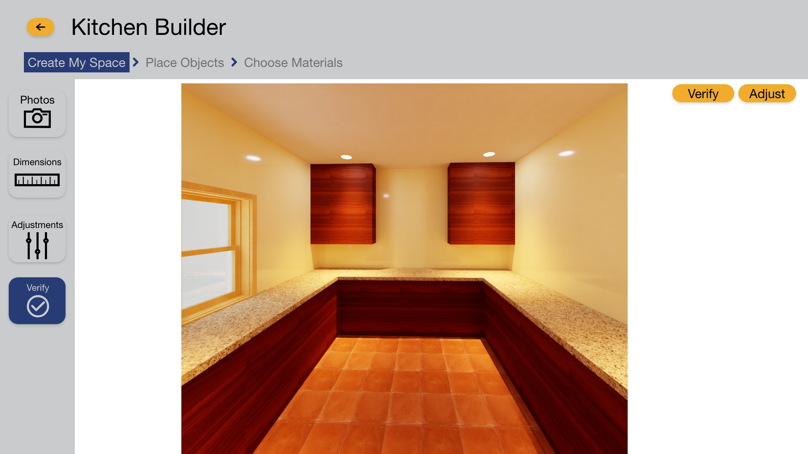
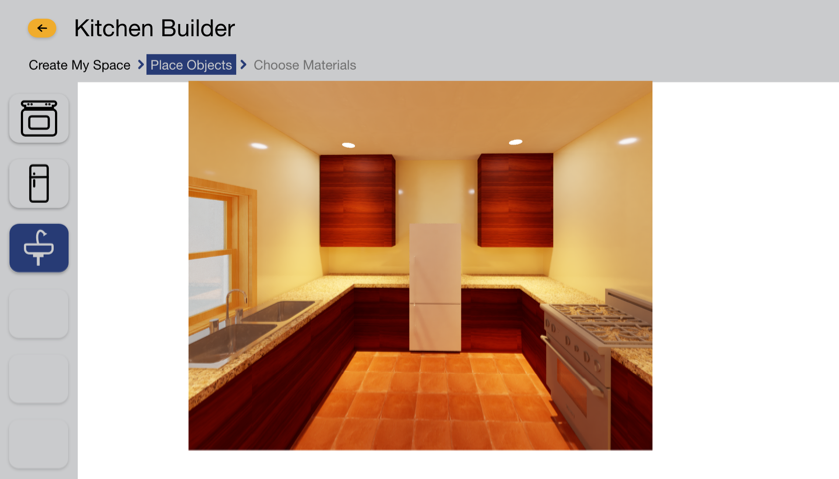
Kitchen Builder was implimented as a click-through Adobe XD prototype. The Prototype provides a click-through experience of the base functionality of the system (three main tasks). First, users upload images to create a visual representation of their kitchen. Second, users add objects and appliances to their kitchen. Third, users add colors and materials to their kitchen.
Evaluations
The first evaluation was a heuristic evaluation with two experts in software design. The second evaluation was a user evaluation with with ten potential users of the interface.
First Evaluation
The first heuristic analysis provided early and effective design feedback. We used Nielsen & Molich's nine heuristics. We had two evaluators conduct the analysis. Each evaluator used the system on their own with some guidance from the team and applied the nine heuristics to find and record problems with the system. Next, the team rated the severity of each error found. The severity of the issue is rated on a scale from zero (not a usability problem) to four (a usability catastrophe). After every issue was rated for severity, the group organized and debriefed all of the information about the issues. We discussed which issues will inform the design of the next prototype and developed design recommendation to use in the next stage of prototype development.
Second Evaluation
The second user evaluation used scientific methods to evaluate the difference between the low-fidelity and high-fidelity conditions.
Participants
The 10 users were representative of a young adult demographic (18-30) some are graduate students and some hold jobs.
Scenarios and Tasks
Participants used the system to construct a space and insert appliances. After they use the system, they will have a conversation with a “contractor” about their redesign project. We will measure their interaction with the system as well as their interaction with the contractor.
Independent Variables (IV)
The independent variable is the level of graphical fidelity in the system. The conditions are drafted (low fidelity) and photorealistic (high fidelity).
Dependent Variables
Usability, Satisfaction, Mental Activity, Confidence level.
Procedure
The particiapnts consentes to the study and recieves instuctions. The first task is to renovate a kitchen from an existing drafted kitchen. This task includes two steps: (one) generating an image of the kitchen and (two) inserting furniture. After the user completes the task, they complete the usability, mental activity, satisfaction, and confidence surveys. The second task is to speak with a contractor about the redesign of the kitchen. The contractor asks a series of questions about the design of the kitchen. After the second task, the user completes a survey about their confidence while talking to the contractor.
Hypotheses
The first research objective is to evaluate the users’ level of mental activity with the drafted (low-fidelity) and photorealistic (high-fidelity) visualizations in the Kitchen Builder application:
H1: There is no difference in mental activity between the drafted and photorealistic visualizations.
H1a: There photorealistic condition will decrease user’s mental activity.
The second research objective is to evaluate the users’ level of satisfaction with the drafted (low-fidelity) and photorealistic (high-fidelity) visualizations in the Kitchen Builder application:
H2: There is no difference in user satisfaction between the drafted and photorealistic visualizations.
H2a: There photorealistic condition will increase user’s satisfaction.
The third research objective is to evaluate the users’ level of confidence when they use the drafted and photorealistic artifacts to communicate with a contractor about their design:
H3: There is no difference in the users’ confidence between the drafted and photorealistic visualizations.
H3a: There photorealistic condition will increase users’ confidence in communicating with the contractor.
Results
The measures between the drafted and photorealistic conditions are reported. We failed to reject the null hypothesis for every evaluation. For every test, the p-value is greater than the significance level. There was not enough evidence to conclude that the difference between the population means is statistically significant.
Mental Activity
The alternative hypothesis (H1a) was accepted for lelve of mental activity. An independent-sample t-test was conducted to compare the memory load in the drafted and photorealistic conditions. There was no significant difference in the scores for drafted (M=1.8, SD=0.748) and photorealistic (M=2, SD=0.707) conditions; t(7)=-0.36, p=.36. These results suggest that the fidelity of representation does not have an effect on the mental activity of users.
Confidence Level
The alternative hypothesis (H2a) was accepted for level of confidence. An independent-sample t-test was conducted to compare the confidence level in the drafted and photorealistic conditions. There was no significant difference in the scores for drafted (M=3.8, SD=0.7) and photorealistic (M=4, SD=0.6) conditions; t(7)=-0.36, p=.36. These results suggest that the fidelity of representation does not have an effect on the confidence level of users.
Satisfaction
The alternaitve hypothesis (H3a) was accepted for level of satisfaction. An independent-sample t-test was conducted to compare the satisfaction level in the drafted and photorealistic conditions. There was no significant difference in the scores for drafted (M=2.2, SD=0.748) and photorealistic (M=2, SD=0.707) conditions; t(7)=-0.36, p=.36. These results suggest that the fidelity of representation does not have an effect on the satisfaction level of users.
Discussion
The high-fidelity graphics were not significantly preferred compared to the low-fidelity graphics. There was not a significant difference in users’ mental activity, level of confidence, or level of satisfaction. This was unexpected, as we expected the photorealistic condition to impact the user experince. We suspect that there is a difference that was not detected because of the experimental design. The study enrolled a low number of particiapnts and may have not impose effective constraints for users to value the photorealistic graphics. In order to come to a more difinitive conclusion, we would like recruite more partricipants and more realistic constraints. For the measure of confidence, we suspect that the contractor’s conversation challenging enough to make the participant feel more or less confident in their responses (e.g., interrogative elements). Another option is that the system did not provide enough functionality for the user to feel ownership over their design.
We expected our results to align with Nehring (2009) found that graphical fidelity had a significant impact on participant’s experinces of nursing simulation. We thought the graphical fidelity in Kitchen Builder would have a similar impact on participants' experiences. However, we did not observe the similar results. Graphical fidelity may not have the same impact on participants' experinces in this domain, but the topic needs more reserach, since there are major weaknesses in our experimental design (the number of participants and the realism of the tasks).
Our results were more in line with Gerling et al. (2013) who found that high fidelity graphics led to higher positive ratings of the game but were not needed for the game to be rated compelling or enjoyable. In our case, participants liked the high-fidelity graphics, but there were mixed results (and no significant results) about the value of high-fidelity graphics in the system.
Recommnedations
We recommend conducting a third iteration of design and evaluation. The third design iteration would take the input of the users' own kitchen photos, allow for changes in color, and allow for changes in materials. These changes may help the participants become more invested in the design of the kitchen and accentuate the differences between the drafted and photorealistic graphics. The third evaluation should sample a larger number of participants. A sample with more participants will better represent of the user population. A statistical power analysis can provide an appropriate number of particiapnts. It may also be important to include a more targeted sample of particiapnts who own homes and want to redesign their kitchens. These users may be more invested in the process and have different experinces than the users who are not invested.
References
- Gerling, Kathrin M. et al. “The Effects of Graphical Fidelity on Player Experience.” Proceedings of International Conference on Making Sense of Converging Media. 2013. DOI 10.1145/2523429.2523473
- Nehring, Wendy M. “Nursing Simulation: A Review of the Past 40 Years.” Simulation and Gaming, vol 40, no 4, 2009, pp. 528-552.